
-
Upgrading Your Skills to MCSA Server 2012 – Monitoring and Maintaining Server 2012 (70-417)
Posted on November 3, 2013 by Michael in Latest News, Studying, Tutorials
For part 6 of this series I’m going to take a look at one of the most important areas when it comes to IT systems and that’s monitoring and maintaining server 2012.
I’m sure I don’t need to explain why it’s important to monitor your systems (and also the importance of doing so) – correctly might I add…
As an Administrator the last thing you want is a mailbox full of alerts, so it’s important you setup monitoring correctly to only alert you to issues you wish to be made aware of.
For smaller/medium sized organisations, the built-in tools included within Server 2012 will be more than adequate, but for larger organisations then of course more powerful solutions should be used (for example SCOM/SCCM).
So what are some of the reason’s we monitor our systems?
- Health of the IT infrastructure:
- Normal activity
- Abnormal activity
- SLA monitoring:
- Monitor SLA areas to prevent issues
- Planning for future requirements:
- Capacity
- Reallocation
- Identifying issues:
- Reactive
- Proactive
Let’s face it, no one likes to constantly fire fight issues (reactive), if we can be alerted to issue ahead of time we can take the necessary steps to prevent an issue from arising (proactive).
But it’s not just reasons like that why we monitor systems, wouldn’t it be nice to establish a baseline of your IT systems to help you determine typical operating conditions, and then be alerted when operating conditions increase.
If this happens on a regular occurrence and you are constantly seeing more demand on the IT systems, it will help you in predicting requirements for future server capacity / upgrades.
All this is well and good but what is it we are going to monitor?
The most common items you would monitor would be:- Processor
- Disk
- Memory
- Network
Let’s face it if either one of those main areas start’s to degrade in performance it has a knock on effect for the rest of the systems.
For example if a particular application is using a high amount of memory this leaves less free resources for other applications meaning if they also require a high level of memory, the resource won’t be available and hence cause the application to degrade in performance.
It’s the same with the processor. Anyone with a home lab knows how far they can push their kit, I think my record was 12 x exchange 2010 boxes spread over 2 ESXi hosts which are (DL385 G1’s) so simple AMD dual core processors. The first couple of virtual machines performed as expected, as the 7th and 8th started to power up and load the OS, you suddenly notice the other servers become a lot less responsive. By the time the 11th and 12th were up and running, it was almost pointless attempting to use these servers as so little resource was left for them.
As for network….well everyone knows what the effects can be here (and even to some degree home users if you compare it to their home broadband and downloading).
Just how do we go about monitoring the above then?
Well there are a number of tools available to us:
- Event Viewer – Collects information relating to server operations
- Task Manager – Provides information related to hardware performance and applications that are currently running on the server
- Resource Monitor – Provides real-time performance-related information about the server
- Performance Monitor – Provides both real-time and historical monitoring of the server’s performance
- Reliability Monitor – Provides a historical view of the server’s reliability-related information
In this first example we are going to go through and create a very simple data collector set.
From within Server Manager, click Tools, and then click Performance Monitor.

In the navigation pane, expand Data Collector Sets, click User Defined, and then click Server Manager Performance Monitor.

Here you can see a default Server Manager Performance Counter. Double click to see what this is currently reporting on
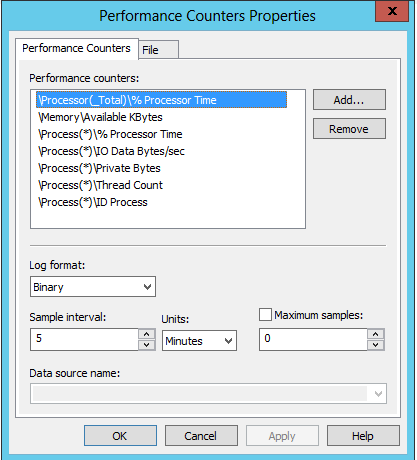
But we don’t like default or standard so let’s create our own….
Right click “User Defined” and select new data collector set and name it something relevant…

Select create manually (Advanced)

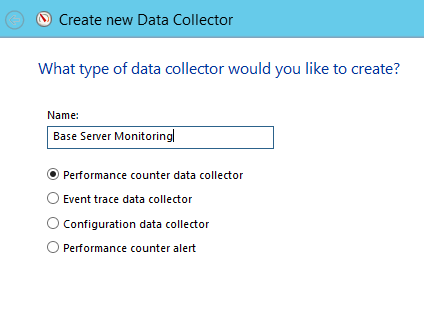
For this set we will create a performance counter

Once created, right click and select New > Data Collector
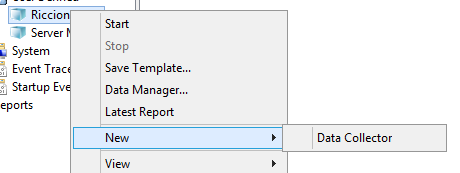
Again call it something relevant
Select the relevant counters for those items you would like to monitor

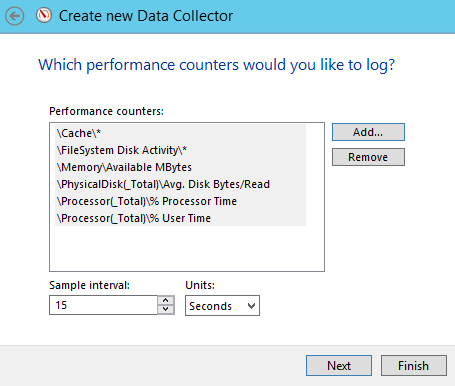
Finally select finish.
I’m now going to remove the default blank performance monitor set which was created…

Right click > Start
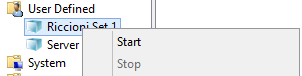
I then went through and opened up a few windows, opened up a few PowerShell prompts and stopped the monitor

Right click > Latest report
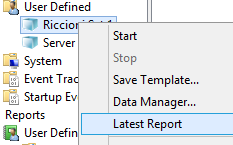
And you’ve created a colourful graph!

To help view what’s been going on I’m going to un-tick the majority of these and report only on the first four.

Simply put this shows there was some level of activity for the 30 seconds I monitored the server….
As shown in the above example, we monitored a couple of the most common items, but generally the most common items you monitor tend to be: Cache, memory, objects, paging file, physical disk, process, processor, server and system.
Of course, that’s all well and good but it would be a lot handier if we could be alerted when certain counters reached a set threshold. Well luckily for you we can…Follow the above example but instead of selecting “performance counter data collector” simply select “Performance counter alert” when creating the data collector…
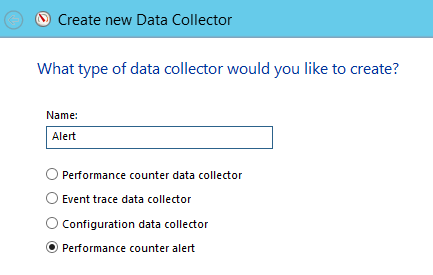
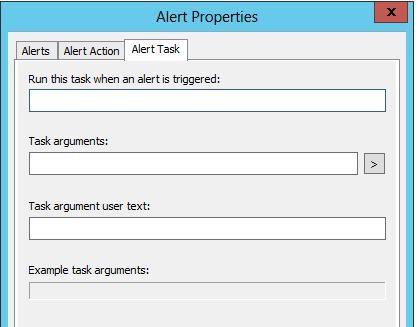
From here we can then configure the relevant options of what to do once a counter’s set threshold is reached, for example write to the event log
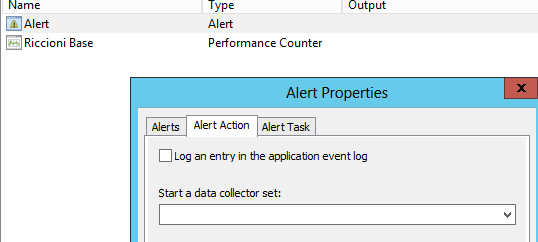
Or configure it to email you/alert you another way…
Now we’ve looked at single servers, wouldn’t it be good if we could collect these logs from multiple servers and send them to one place (one server) so we have access to all the different server logs in our environment from a single source.
This is where we bring in event subscriptions, basically this will allow you to collect copies of events from multiple remote computers, and store them locally.
Keep in mind there are two parts to this configuration, you must configure both the collecting computer (collector), and each computer from which events will be collected (source).
This is what i’ll be showing in the next example below, now there are a quite a few steps to this next part, and as this blog has already gone on I won’t be showing step by step screen shots, instead I’ll give you a step by step guide (which is just as good!)
In this example we will setup the collector to be MRDC01 and the source to be MRSVR01
Firstly we need to configure the source server…
- First we need to configure quickconfig (from a command prompt type winrm quickconfig
- In Server Manager, click Tools, and then click Computer Management.
- In the Computer Management console, expand Local Users and Groups, and then click Groups.
- In the details pane, double-click Administrators.
- Click Add, and in the Select Users, Computers, Service Accounts or Groups dialog box, click Object Types.
- In the Object Types dialog box, select the Computers check box, and then click OK.
- In the Select Users, Computers, Service Accounts or Groups dialog box, in the Enter the object names to select box, type MRDC01, and then click OK.
That’s the source computer configured, now let’s move on to the collector…- At the command prompt, type wecutil qc, and then press Enter.
- When you are prompted, type Y, and then press Enter.
 Now we need to create a subscribed log
- In Server Manager, click Tools, and then click Event Viewer. (or type eventvwr from a run box)
- In the Event Viewer, in the navigation pane, click Subscriptions.
- Right-click Subscriptions, and then click Create Subscription.
- In the Subscription Properties dialog box, in the Subscription name box, type MRSVR01 Events.
- Click Collector Initiated, and then click Select Computers.
- In the Computers dialog box, click Add Domain Computers.
- In the Select Computer dialog box, in the Enter the object name to select box, type MRSVR01, quickly test the connection, if successful click OK and then click OK
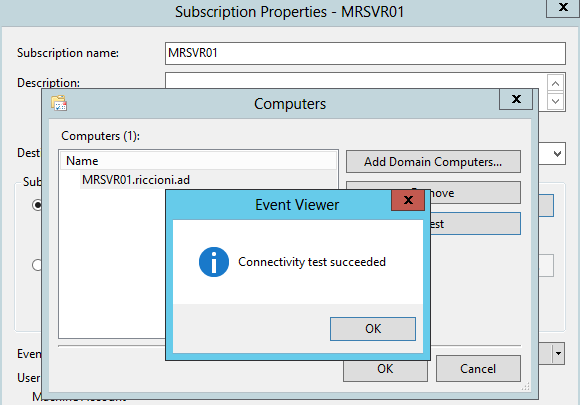
- In the Subscription Properties – MRSVR01 Events dialog box, click Select Events.
- In the Query Filter dialog box, select the Critical, Warning, Information, Verbose, and Error event level check boxes.
- In the Logged list, click Last 7 days.
- In the Event logs list, select Windows Logs, click OK and then OK again to return to the main event viewer window.
Now if we view the forwarded events log under Windows Logs we should start to see events from MRSVR01

Finally in this blog we will cover off backups. Like monitoring, I’m sure I don’t need to explain why backups are important, but if you are not backing up regularly then start!
I’m aware most people will use third party backup solutions, which is fine but unfortunately for the exam we need to cover off Windows Server Backup even if you don’t use it.
So what can windows backup do?
- Back up full server (all volumes)
- Back up selected volumes
- Back up specific items for backup
- Perform a bare-metal recovery
- Perform a system state backup
- Back up individual files and folders
- Exclude selected files or file types during backup
- Select from more storage locations for the backup
- Use the Microsoft Online Backup Service
As the “buzz” word in the IT world has been “cloud” for a while now, of course Microsoft offer their own version of backing up to their cloud platform known as Azure. This means you can be safe in the knowledge that your backups are now stored offsite in one of Microsoft’s datacentre’s somewhere….
Again, it’s not something I would specifically use, but for the exam you should really know the below can be done using the Azure setup.
- Simple configuration and management
- Block-level incremental backups
- Data compression, encryption, and throttling
- Data integrity verified in the cloud
- Configurable retention policies for storing data in the cloud
In order to use this service you obviously need an Azure account ID, but once you have that you can then go through and configure your server backup. I’m not going to bother going through this stage, as it’s pretty much a few clicks via windows server backup (once you have your account ID).
Instead let’s look at local backups (backup’s to tape/disk etc…), as this is going to be more applicable for the majority of us.
Unfortunately opening up windows server backup presents us with the following:

So go ahead and install the Windows Server Backup role and then return to the window. We can now configure a local backup.

What might you want to backup then?
DHCP, Certificate Services, IIS, DNS, File and Print….the list is endless, ideally you should backup whatever is required to restore your environment to its “as-was” state before anything happened.
This brings us on to recovery, something we’ve all had to do at some point, and as with any backup product the built in tools allow for the following recovery options:
- Files and folders
- Applications and data
- Volumes
- Operating system
- Full server
- System state
This means we can also restore to the following locations:
- Original host or new host: Bare-metal restore
- Importing to Hyper-V Server
- Boot to VHD
Depending on your environment the above may be very handy. You should also consider how you will recover your data. For example
- Allowing users to recover their data
- Recovering data to an alternate location
- Recovering data to the original location
- Performing a full volume recovery
Again it will vary depending on your environment but in terms of a non-third party backup solution Windows Server 2012 does do a good job of it.
Just quickly to wrap up this (never ending) blog, I’ll go through the steps for creating a simple backup.
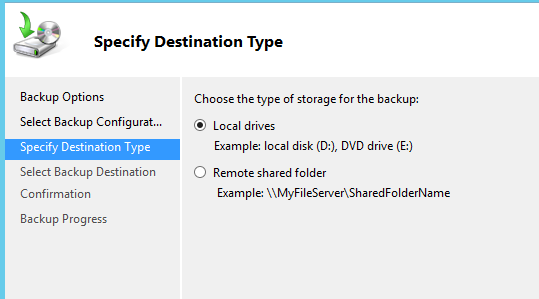
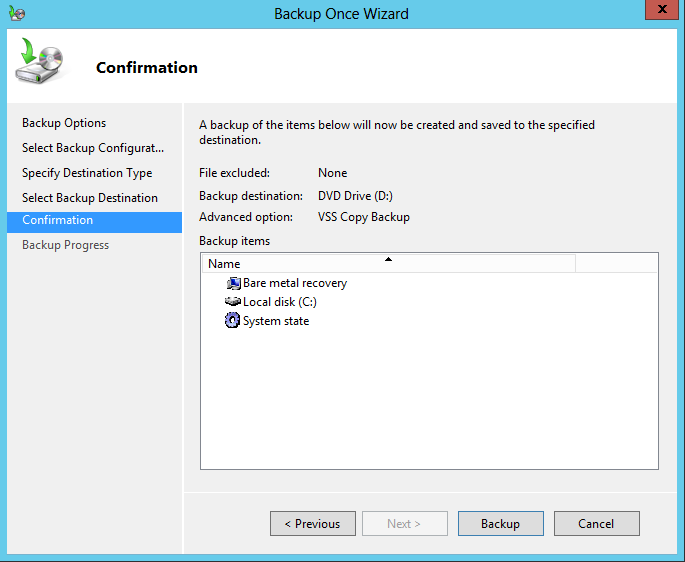
From within the Windows Backup console, select “backup once” (obviously for a scheduled backup select that option)…
Then simply follow the on-screen instructions. As you will see below it’s very straight forward…


And that wraps up the Monitoring and Maintaining Server 2012 blog….
- Health of the IT infrastructure:
Great blog Mike, look forward to more SCOM writing.